
File Federal Unemployment Extension
Daily News Update
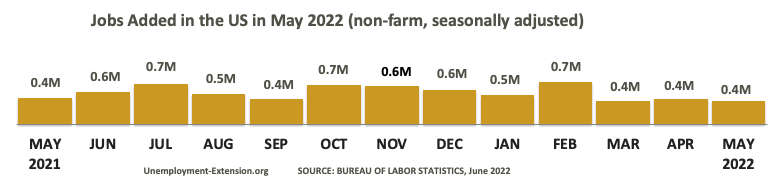
June 6, 2022 Update: Federal Unemployment Extension. May`s national unemployment rate remains flat at 3.6% since March. US economy added 390,000 jobs in May of 2022. The US labor force participation rate is 62.3% (up 0.1%.) Inflation is at 8.3%. The real national unemployment rate decreased by 0.1% to 7.1%. There are currently 5.7 million individuals who want to find a job but cannot find one (down 0.2 million since last month.) May`s unemployment rate among population segments were as follows: Whites 3.2% (flat), adult men 3.4% (down 0.1%), adult women 3.4% (up 0.2%), Hispanic 4.3% (up 0.2%), Asian 2.4% (down 0.7%), African American 6.2% (up 0.3%), replica watches teenagers 10.4% (up 0.2%.) The weekly national unemployment rate is at 0.9% (down 0.1%.) The new number of claims decreased by 11,000 to 200,000. The four-week moving average is flat at 206,500. Insured unemployment decreased by 34,000 to 1.3 million.
More news

May 8, 2022 Update: April`s national unemployment rate remains flat at 3.6%. US economy added 428,000 jobs in April of 2022. The US labor force participation rate is 62.2% (down 0.2%.) Inflation is at 8.5%. The real national unemployment rate increased by 0.1% to 7.2%. There are currently 5.9 million individuals who want to find a job but cannot find one (down 0.1 million since last month.) April`s unemployment rates among population segments were as follows: Whites 3.2% (flat), adult men 3.5% (up 0.1%), adult women 3.2% (down 0.1%), Hispanic 4.1% (down 0.1%), Asian 3.1% (up 0.3%), African American 5.9% (down 0.3%), teenagers 10.2% (up 0.2%.) The weekly national unemployment rate is at 0.9% (down 0.1%.) The new number of claims increased by 19,000 to 200,000. The four-week moving average increased by 8,000 to 188,000. Insured unemployment decreased by 19,000 to 1.4 million.
More news
April 3, 2022 Update: March`s national unemployment rate decreased to 3.6% (down 0.2%.) US economy added 431,000 jobs in March of 2022. Most of the month-over-month job gains took place in Hospitality +112,000, Professional Services +102,000, Education +53,000, Retail +49,000, Manufacturing +38,000, and Construction +19,000. The US labor force participation rate is 62.4% (up 0.1%.) Inflation is at 7.9%. The real national unemployment rate is flat at 7.1%. There are currently 5.3 million individuals who want to find a job but cannot find it (up 0.4 million since last month.) March`s unemployment rate among population segments were as follows: Whites 3.2% (down 0.1%), adult men 3.4% (down 0.1%), adult women 3.3% (down 0.3%), Hispanic 4.2% (down 0.2%), Asian 2.8% (down 0.3%), African American 6.2% (down 0.4%), teenagers 10.0% (down 0.3%.) The weekly national unemployment rate is at 0.9% (down 0.1%.) The new number of claims increased by 14,000 to 202,000. The four-week moving average decreased by 3,500 to 208,500. Insured unemployment decreased by 35,000 to 1.3 million - the lowest level since 1969.
More news
June 2022 Unemployment Update
Latest June 2022 news regarding the extension. For those who were not certifying for federal extension benefits due to going back to work, school or other situation but still had a remaining balance left on a federal extension claim, they have to reopen their claim if they are in need of extended benefits. The EDD recommends submitting a claims online to reopen their extension claims.
COVID-19 (Coronavirus) impact - live View
US Economy added +390,000 new jobs in May of 2022
Reported in June of 2022, US economy added 390,000 jobs in May of 2022. The unemployment rate flat at 3.6% with a total of 6.0 million unemployed (increased by 9,000 in May 2022). May`s unemployment rate among population segments were as follows: Whites 3.2% (flat), adult men 3.4% (down 0.1%), adult women 3.4% (up 0.2%), Hispanic 4.3% (up 0.2%), Asian 2.4% (down 0.7%), African American 6.2% (up 0.3%), teenagers 10.4% (up 0.2%.)
Non-farm, seasonally adjusted employment increased by +321,000 (+6.8 million in the past 12 months) to reach 158.4 million. The number of long-term unemployed decreased to 1.4 million (down 127,000) in May 2022. Long-term represent 23.2% of all unemployed (down 2.1% since last month.) The unemployment rate in May decreased for long-and mid-term unemployed and increased for mid-term category.
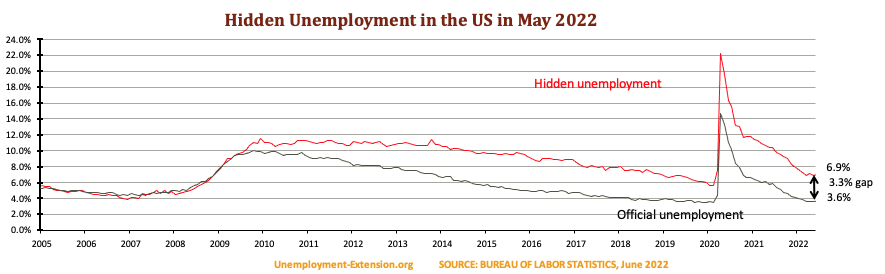
The Real National Unemployment Rate decreased by 0.1% to 7.1%. This rate is 0.2% lower than the lowest pre-COVID-19 level. There are currently 5.7 million (down 178,000 in May and down 919,000 in the past 12 months) individuals who want a job but are not considered unemployed and, for this reason, are excluded from the official unemployment figures.
Employment Metrics Most of the employment metrics have improved since November 2021. Fed are considering to increase interest rates in 2022. The US Prime Rate remains unchanged at 3.25%. Economists predict there is a 25% chance of a recession in mid-2022. Economists are currently unable to identify possible causes of the upcoming economic recession. Most of the month-over-month job gains took place in Healthcare +72,000, Construction +44,000, Hospitality +36,000, Transportation +28,000, Government +19,000, offset by losses of -12,000 in Manufacturing, and -8,000 in Retail. In the past 12 months, Healthcare added +563,000 new jobs, Professional Services +240,000, Hospitality +198,000, Government +177,000, Financial Services +177,000, Transportation +156,000, and Construction +130,000, while Retail lost -168,000 jobs since January of 2019. All industries and sectors average hourly earnings increased by 7 cents in January of 2020 (+3.1% up since January of 2019.)
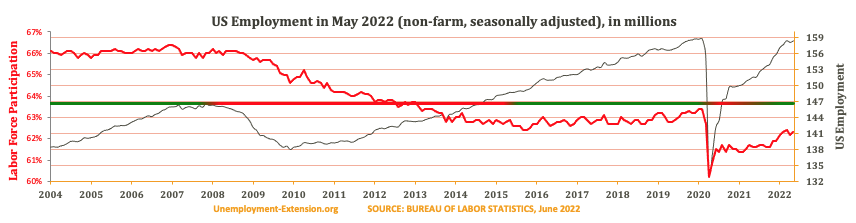
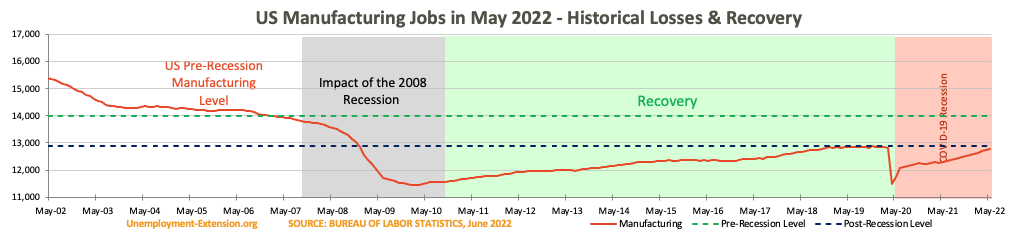
Labor Force Participation Rate in January of 2020 improved to 63.4% (+0.2%) or 2.8% below of what it was in January of 2008 - the highest pre-recession employment level of 66.2%. 1.1 million of the high-paying US manufacturing jobs have been lost from the economy since 2007 (12.9 million in December of 2019 vs. 14.0 million in January of 2007), and instead, have been replaced with considerably lower-paying service jobs. This situation has somewhat improved in 2018 but became stagnant in 2019/20. Also, manufacturing jobs are slowly falling out of favor, and manufacturers in many regions find it increasingly difficult to attract employees. In the past 12 months, Manufacturing added a meager +29,000 new jobs and lost -14,000 since its peak in November 2019. Manufacturing added +1.4 million jobs since the historically lowest level of 11.5 million in Mar 2010. Job growth in Manufacturing slowed down and stagnated since mid-2019.
In-Focus Retail industry lost -123,000 and Wholesale -68,000 jobs since December of 2018. Information jobs increased by +79,000. New highly paying Machine Learning (AI) and Data Science fields have hard times establishing a sizable footing in the US. Instead, the funding and employment opportunities keep on moving directly to China, India, Canada, and even Australia. China has announced a plan to dominate the AI industry by 2030. Outsourcing of High-Tech jobs destroys any hopes for US middle-class upward mobility. The long-term unemployed 1,186,000 (down by -33,000 in December) - out of work for 27 consecutive weeks or longer. Despite the full employment in many states, this group finds it extremely challenging to get employment, as employers perceive their skills as outdated. Teenagers (16-19 years old) are still the most impacted by job losses population group with the highest unemployment rate of 12.6% (up 0.6% in December and flat in the past 12 months) and the lengthiest unemployment across all races, genders and age groups.
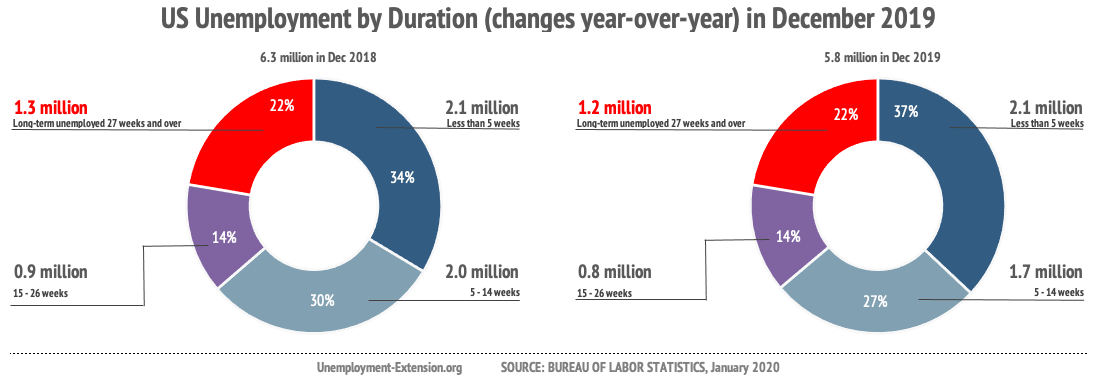
Changes in long-term unemployment in December of 2019: long-term unemployment (27 weeks and over) decreased by -33,000 in December of 2019; mid-term (5-26 weeks) increased by +55,000; short-term (less than 5 weeks) decreased by +118,000. Over the past year, the number of long-term unemployed declined by -106,000 and represents 20.6% (down 0.4% since November) of all unemployed. Regretfully, many of these individuals ran out of benefits and consequently reclassified as not in labor force and get gradually replaced by those in the mid-term group. Opioid and Long-Term Disability (LTD) are among the main contributing factors. The number of not in labor force decreased by 24,000 in the past 12 months. The latest studies revealed that publicly funded trade schools are one of the most effective methods of bringing unemployed back to the labor force. Skilled trades are among the highest paid professions and largely immune to automation or AI threats.
Millions of adult Americans are still unable to find a meaningful full-time job, have given up looking for one or accepted unemployment as a status quo. This large group of adults represents a unique economic and political opportunity. It is our goal to leverage their skill and talent to produce economic benefits.
The hidden unemployment rate in the US in February of 2020 remains unchanged at 5.6%, marking a gap of 2.5% to official US unemployment. Real unemployment, unlike official unemployment figures, includes individuals who want to work but are unable to find a job.
Unemployment rates were lower in 4 and higher in 2 states. There was no change in 44 states and the District of Columbia. 8 states had jobless rate decreases in the past 12 months, 3 states had risen, and 39 states and the District are flat. The national unemployment rate, 3.6%, was little changed since September 2019 and from October 2018.
Employment rose in 4 states in October 2019, declined in 1, and flat in 45 states and the District of Columbia. In the past 12 months, 27 states added nonfarm payroll jobs, and 23 had no change.
Layoffs and Job Gains
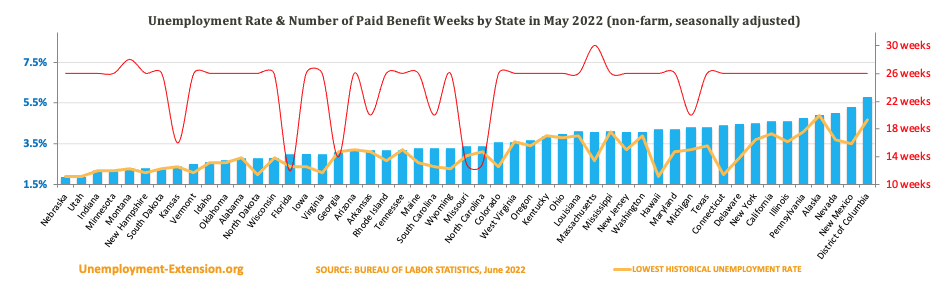
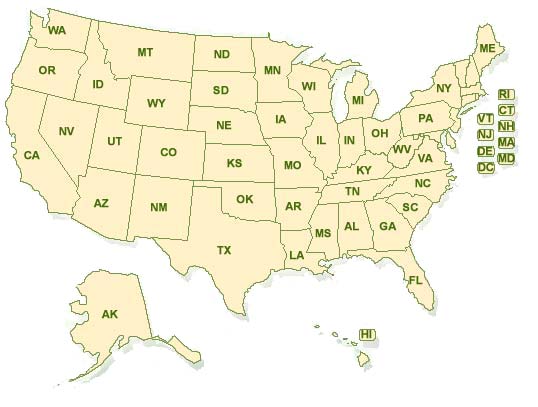
In October 2019, VT had the lowest unemployment rate of 2.2%. The unemployment rates in AL 2.8%, CA 3.9%, ME 2.8%, and SC 2.6% mark the new lowest rates. AK has the highest jobless rate, 6.2%. 15 states have unemployment rates lower than the US national of 3.6 percent, 12 states and the District of Columbia had higher, and 23 states have rates that were at the same level as the national unemployment rate.
SC experienced the most substantial over-the-month unemployment rate drop of -0.3% in October, followed by AL and UT at -0.2%, and GA -0.1%. DE and PA had their rates increased by +0.2% each. The remaining 44 states and the District of Columbia are flat month-over-month.
AL and CO had the most significant year-over-year unemployment rate decrease of -1.0%. The most substantial rate hike from October 2018 happened in MS +0.8%.
Nonfarm Payroll Employment
In October 2019, nonfarm payroll employment increased in 4 states. The job gains of +30,100 took place in TX +0.2%, MD of +10,700 or +0.4%, UT of +6,700, or +0.4%, and NE of +5,200, or +0.5%. Employment declined in Michigan of -21,800, or -0.5%.
27 states had year-over-year improvements in nonfarm payroll employment. The most considerable job gains happened in CA +308,000, TX +297,100, and FL +228,600. The most significant % gains happened in UT of +3.2%, FL of +2.6%, and AZ of +2.5%.
Unemployment News & Resources
June 17, 2015: Improving unemployment claims figures and a 15-year low unemployment rate are not the best indicators of the health of the labor market. In fact, the insights they provide are inadequate to determine why unemployed individuals may no longer be in the labor force. For example, 6.5 million of US unemployed are still looking for jobs but no longer considered part of the 5.3% May unemployment rate. Continue reading
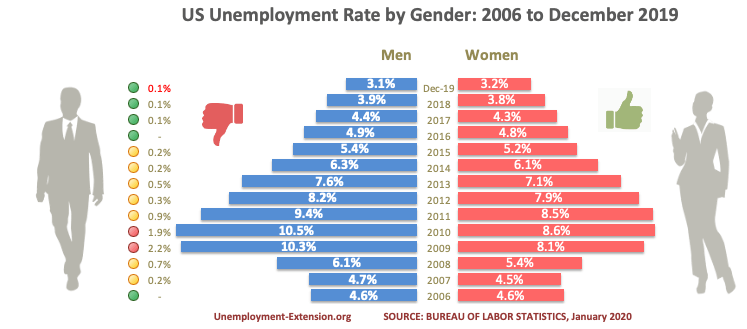
May 26, 2015: While over 50% of all low-end jobs at Fortune 500 companies are occupied by women, only 1 out of 7 corporate board and executive roles are held by women. Women are also more pre-disposed to get trapped in low-paying jobs than their male counterparts. Here are some answers. Continue reading
May 2, 2015: Bureau of Labor Statistics recently reported that the oil and gas industry lost roughly 2,000 jobs. That announcement came as a shocking surprise to individuals affected by layoffs in that industry. Based on alternative sources, the job losses were significantly understated in comparison to what was actually taking place. Industry review published by Challenger, Gray & Christmas proclaimed shocking 21,300. The drop in oil price alone accounted for 20,000 lost jobs in Texas. Here is why the figures are so different. Continue reading
April 27, 2015: 2016 presidential race is heating up. Four major contenders, among them one Democrat and four Republicans, have already tossed their hats into the ring. Here is how these four presidential hopefuls propose to tackle the unemployment. Continue reading
April 20, 2015: In spite of multiple warnings that number of states have overpaid millions of dollars in unemployment benefits, they have continued issuing such benefits to state employees, prisoners, and even the dead individuals, while 3 million people who are considered long-term unemployed receive no benefits at all. Continue reading
April 14, 2015: A new research conducted by the Emory University of Atlanta found that depression among unemployed young adults is three times as high as that among their employed peers. The study suggests that a high unemployment rate isn’t just an economic issue. It is also a public health problem. Continue reading
April 6, 2015: Despite weaker economic growth in the 1st quarter of this year, eight states have already reduced the unemployment benefits to less than 26 weeks, while others are exploring the possibility of either decreasing the number of weeks or cutting the weekly amounts. Much of this notion is driven by the fact that lately claims have experienced a significant decline. Continue reading
March 29, 2015: Unemployment numbers reported in February exceeded the expectations of economists and asserted that unemployment improved to pre-recession level. While this is certainly good for the U.S. economy, the long-term unemployment figures have changed very little. There are currently 2.7 million long-term unemployed that account for 31% of all unemployed Americans. These individuals may experience a reduction of their wages up to as much as 10% for as long as ten years after getting hired. Continue reading
March 18, 2015: A new study conducted by the National Bureau of Economic Research claims that Congress’s decision not to extend unemployment benefits in 2014 truly helped workers and created 1.8 million extra jobs. So what is the conclusion? Cut the unemployment benefits and unemployment will go down. The facts, as it turns out, are far more complex. Continue reading
March 3, 2015: Long-term unemployed or recently lost your job? Depression and suicidal thoughts start invading your mind? Well, you are not alone. According to the latest study conducted by Swiss scientists, about 20% of all suicides are linked to unemployment. Also, if you can recommend any local suicide help services, support groups or hotlines, please forward this information to us and we will share it with those in need. Continue reading
February 18, 2015: In the past 13 month, the economy added almost 3.5 million new jobs, including 750,000 in November and December. The labor participation rate grew to 62.9% from 62.7% in December. Also, here is why the unemployment rate increased to 5.7% in January. Continue reading
February 8, 2015: Regardless of the fact that over 2% of the country’s labor force is still unemployed for more than six months, the steadily declining weekly initial unemployment claims signify an ever strengthening employment market. Our analysis indicates that Republicans will be focusing on cutting expenses rather than funding EUC this year. The overall expectation is that the unemployment rate will drop so low by mid-2015 that employers will start hiring long-term unemployed. Continue reading
January 29, 2015: What will the US unemployment situation look like in 2015? Let’s take a look at some of the most important unemployment predictions. The economy generated an impressive 2.95 million new jobs. Joblessness rate fell to 11.2%. People are getting hired, but wages are still stagnating. Projections indicate that wages will increase by 2.5% this year. Continue reading
January 22, 2015: “2014 was a truly outstanding year for the labor market,†James Marple, an economist at TD Securities, explained, “Companies are increasingly looking to hire.†Economists forecast that in 2015, the U.S. economy will continue powering ahead of other large economies, notably those of Europe with the grow of more than 3%. Long-term unemployment fell by 27% last year. Still more must be done to boost stagnating wages. Continue reading
January 15, 2015: As a result of high student loan burdens, in conjunction with high rates of unemployment and underemployment, 7 million Americans or 18% of all education debt holders defaulted on their student loans. With over 60 percent of employers checking credit scores before hiring or promoting, ineligibility for some federal jobs, and withheld educational transcripts, those who need employment most desperately, suffer the most. Continue reading
January 7, 2015: While the short-term unemployment rate is on the decline, over 2% of the labor force remains long-term unemployed. What is even worse, finding and keeping jobs can be particularly problematic for the long-term unemployed. 30% of the long-term unemployed that eventually find a job lose it within 12 months. Studies reveal discrimination towards the long-term unemployed, also known as an “unemployment trapâ€. Continue reading
December 30, 2014: While the unemployment rate may have settled at a 6-year low, it can certainly be argued that the need to extend unemployment benefits still exists. The Bureau of Labor Statistics announced that the long-term unemployment situation hasn`t improved and approximately 2.8 million people or about 2% of the country`s workforce remain unemployed for more than 27 weeks. Continue reading
December 22, 2014: With 40% of workforce underemployed, Wal-Mart is notorious for its practice of intentionally low working hours and cuts in health care coverage. While the underemployment crisis might seem like a problem of individual employees, it has economic implications for the entire country. Continue reading
December 15, 2014: Colorado’s unemployment rate is down to an impressive 4.3 percent. That is the lowest level since March of 2008 and down from 4.7 percent in September of this year. Here is what keeps it so low and also why this may actually hurt Colorado`s economy. Continue reading
December 8, 2014: In November, President Obama announced that he will use his executive powers to provide immigration relief to an estimated 5 million undocumented immigrants. Will Obama’s Immigration Action Mean Fewer Jobs for Americans? Continue reading
December 2, 2014: These 9 cities weathered the Great Recession and now boasting the lowest unemployment rates in the United States. Out of work for over 26 weeks? Why not to consider moving there? Continue reading
November 26, 2014: According to the Labor Department, African-American unemployment rate still hovers above 10%, while Caucasian men in America are unemployed at a rate of roughly 4.4 percent. Studies show that white applicants with a criminal record are more likely to get employed than a black applicant with no criminal record. Continue reading
November 18, 2014: Recently, there has been little word from either side of the aisle regarding a possible extension of unemployment benefits for the long-term jobless. At the same time almost 150 workers of Fusion Paperboard received notice that they will qualify for extended unemployment benefits. After exhausting their original 26 weeks of unemployment benefits, Fusion Paperboard employees will qualify to receive additional two and a half years of benefits. Continue reading
November 11, 2014: Citizens and politicians alike are quick to gripe about the United State’s seemingly high unemployment rate. Are things really so bad? Take a look at these four countries with outrageously high unemployment rates. Continue reading
November 5, 2014: Now that Republicans declared a victory in the House of Representatives and national unemployment rate is at 5.9 percent, emergency unemployment benefits (EUC) may never see the light of day. Either way, it is now up to Republicans to deal with the current economic issues. Continue reading
November 2, 2014: Unemployment rates for America`s least educated workers with high school diploma declined much sharper - from 6.2% to 5.3% because most of the post-recession economic growth took place in low-wage sectors. Here is how this will benefit you. Continue reading
October 20, 2014: 20% of Workers Laid Off in the Past 5 Years Are Still Unemployed Today. Unemployment rate among the workers who remain jobless for more than six months is among the most persistent, negative effects of the Great Recession. Long-term unemployment remains above pre-recession levels in 41 states. Continue reading
October 15, 2014: Will the Unemployment Extension be renewed in 2014? Here’s why Obama and Boehner blame both the unemployed as well as lengthy Congressional recesses for missing the Unemployment Extension bill. Continue reading to find out.
October 8, 2014: Some call them “the lost generationâ€. Many believe their "wage scars" will last upwards of twenty years and they will never be able to retire. It is estimated that federal and state governments are losing approximately $8.9 billion in revenue each year because of them. They tear at the very fabric of American society. Continue reading to find out if you are one of them.
September 23, 2014: While the resession may not be over yet, the unemployment rates inch up and there is still no sight of an unemployment extension 2014 bill. According to the Census Bureau, the poverty rate in the United States declined to 14.5 percent, showing 0.5% year-over-year decrease. Continue Reading
September 18, 2014: US unemployment rate is perceived as a major indicator of economic health. It is cited more than any other statistical figure in the world. But now its accuracy has been challenged and here is the reason why. Continue Reading
August 26, 2014: "Human Capital Dynamics and the U.S. Labor Market" report recently released by Federal Reserve Bank of Atlanta indicates that the unemployment extension had no positive impact on employment rate. Continue Reading
August 8, 2014: The portion of Americans between the ages of 25 and 34 who were working in April fell to a five-month low of 75.5%.
Read More: Recent College Grads & Unemployment: How Many Graduates Can Actually Find Jobs? July 22, 2014: Feds recently announced 6.1 percent unemployment rate, which is lowest since George W. Bush was president. But what is the true nature of the unemployment rate? A record 92.5 million people are out of the work force, the cost of gas and food are at all-time sustained highs as is the stock market, and the failure to extend federal unemployment insurance benefits has a downward effect on the unemployment rate, making it look better than it actually is. Also can look at where jobs have been created, which, for the most part, aren`t in high-paying sectors... (Continue reading) July 7, 2014: Federal Funding Available for College Course. Pell Grants Give Up to $5,500 for Training. June 20, 2014: Unemployment Offers Opportunities for New Jobs Training. May 27, 2014: Unemployment Drops as Lawmakers Debate Benefits Extension. May 24, 2014: Federal Lawmakers Continue Wrangling Over Unemployment Extension
Federal tiers are determined by the state`s unemployment rate where the unemployed individual chooses to file for benefits.
US employment is 113,000 jobs short of its highest figure in Jan 2008. Do you feel that the economy is back to normal? Share with us your opinion.
The Online Filing Directory
Benefit Extension: Your eligibility and the total amount of weeks for compensation are the major changes in the 2012 legislation bill. Congress has permitted States to administer drug testing for unemployed individuals seeking an extension of benefits if they were previously laid off due to the use of drugs.
In order to obtain the full 73 weeks of State compensation update, most states still require an active job search, as was the case in 2012.
State requirements of unemployment will vary, relying heavily on the seasonally adjusted unemployment rate.
Extension of Compensation
*Individuals who have collected all regular State benefits are those who can seek eligibility for the new unemployment bill, by starting with 13 weeks of federal extended benefits, referred to as extended Federal benefits or the "EB" Program. The EB Program is also relies on the state`s economic status to determine lengths & amounts.
After utilizing your Extended Benefits for 13 weeks, unemployed individuals can continue receiving benefits through the EUC (More on Emergency Unemployment Compensation). 2013 Extended benefit lengths are determined by which tier the individual falls into. The new Senate bill of December 2012 is comprised of 4 separate EUC tiers (each tier defines how long your extension will last).
Passing of the New Legislation Bill:
Federal Tiers Structure
(63 Weeks to 73 Weeks)
Details of the new enacted tiers, and a comprehensive benefit calculator is available to claimants. These changes were enacted on June 1, 2012 (prior to June, all tiers remained the same for claimants as was the case in 2011 for 99ers. It is important to note that in 2013, there is no tier 5 (99 weeks was reduced to 73 weeks). The 2013 legislation terms for the bill are as follows:
Extended Benefits For 73 Weeks
(UNTIL END OF 2013)
- Tier 1: 14 weeks
- Tier 2: 14 weeks
- Tier 3: 9 weeks
- Tier 4: 10 weeks (when your State is 9% or higher - if your State is losing extended benefits, then you are entitled to 16 weeks of unemployment insurance. Depending on the date you lost your job, you may qualify for a different tier structure.
(TO AUGUST OF 2012)
- Tier 1: 20 weeks
- Tier 2: 14 weeks IF state rate passes 6%.
- Tier 3: 13 weeks IF state rate passes 7%.
- Tier 4: Six weeks IF state rate passes 9%
(SEPTEMBER `12 - DECEMBER `13)
- Tier 1: 14 weeks
- Tier 2: 14 weeks IF state rate passes 6%.
- Tier 3: 9 weeks IF state rate passes 7%.
- Tier 4: 10 weeks IF state rate passes 9%
Maximum Amount of Weeks For Collecting (2012-2013)
Here is an overview of the maximum lengths this year:
- FROM MARCH TO MAY: 99 WEEKS
- FROM JUNE TO AUGUST: 79 WEEKS
- FROM SEPTEMBER TO DECEMBER: 99 WEEKS
Initial Claims (by State)
Unemployed individuals are welcome to check the news update section for the latest legislation revisions to all State benefit plans.
